- Identify clear links between Number framework with national curriculum levels and National standards
-Know how to use assessment data
Knowledge and strategies intertwine.
Knowledge:
Number Id
Number sequence and order
Grouping and place value
IKAN is a tool to assess knowledge
Strategy:
Add/sub
Mult/Div
prop/ratios
GLOSS is a toll to assess strategy
"The primary purpose of assessment is to improve students learning and teachers teaching as BOTH student and teacher respond to the information that it provides"
-How is this assessment informing our planning and teaching?
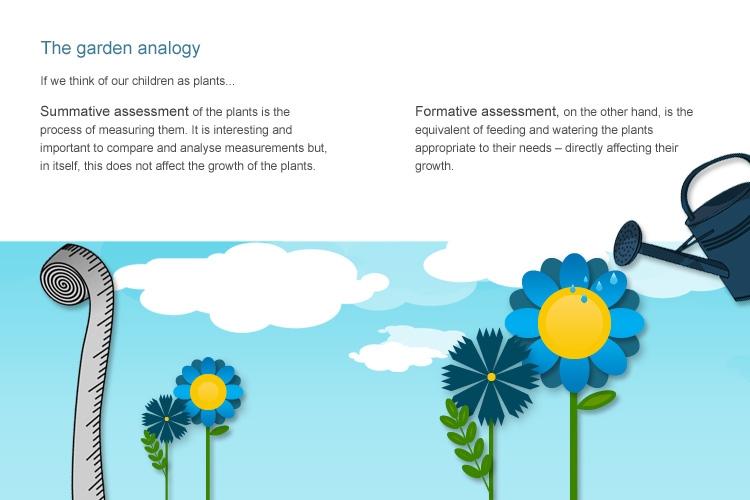
Formative or summative assessment?
Formative assessment, including diagnostic testing, is a range of formal and informal assessment procedures conducted by teachers during the learning process in order to modify teaching and learning activities to improve student attainment.
Summative assessments are used to evaluate student learning, skill acquisition, and academic achievement at the conclusion of a defined instructional period—typically at the end of a project, unit, course, semester, program, or school year.
Exploring Number Knowledge:
Numeral ID, Sequencing and Ordering, Grouping/ Place Value, Basic Facts:
Important pieces of information we should know instantly- or so the Ministry says. Jo disagrees, so took away the time limit on certain sections of the IKAN
Advantages: It is quick
Disadvantages: time pressure, chn have to look up and down, questions go too quick.
Reflection: Maybe IKAN is just to be used for specific chn to provide a snapshot
Maybe give chn to option to sit back with their marked test and they can fix up the ones they know (not wasting time learning what they know) and then pick two things they want to learn based on their mistakes.
Spider graphs for GLoSS and IKAN
These are great to show the glaring gaps, where students are aiming for, and their strengths. Be careful if the kids are working well below, as their lines will all be in the middle and might discourage them.
How do I use the data to inform my planning?
IKAN class summary sheet: shows gaps (highlighted)
Highlight all data, including names
Data: sort range: column d.
This will sort from lowest to highest stage. Will show some common gaps in knowledge that you can fill as the Teacher.
PAT tests:
Individual reports give stanine, where the chn sit on the bell curve, black correct answers, light is incorrect, transparent is omitted. Red line is the average. The key will show you whether the test was too hard or too easy.
Great to see you capturing this Hayley. #rewindablelearning
ReplyDeleteDid you think about embedding her slide show as well to keep it all in one place?
Great idea Dorothy! I will edit it to include it :)
Delete